Variance
With respect to variance, the population variance, , is the sum of the squared differences between each observation and the population mean divided by the population size, N:

With respect to standard deviation, the population standard deviation,
 , is the (positive) square root of the population variance and is defined as

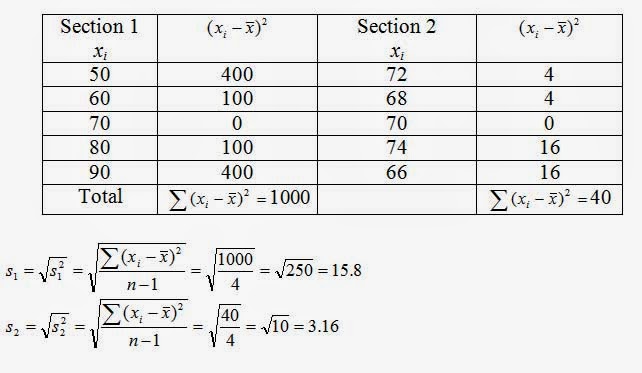
Section 1
|
50
|
60
|
70
|
80
|
90
|
Section 2
|
72
|
68
|
70
|
74
|
66
|
Solution: Although the average grade for both sections is 70, we notice that the grades in section 2 are closer to the mean, 70, than are grades in section 1. And just as we would expect, the range of section 1, 40, is larger than the range of section 2, which is 8.
Similarly, we would expect the standard deviation for section 1 to be greater than the standard deviation for section 2.
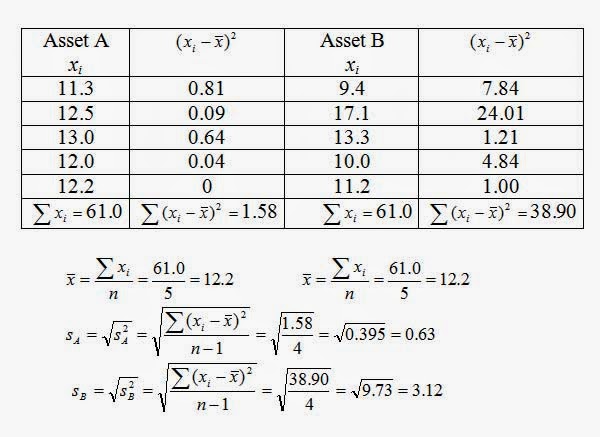
Example: Risk of a Single Asset
Wes and Jennie Moore, owners of Moore’s Foto Shop in western Pennsylvania, are considering two investment alternatives, asset A and asset B. They are not sure which of these two single assets is better, and they ask Sheila Newton, a financial planners, for some assistance.
Solution: Sheila knows that the standard deviation, s, is the most common single indicator of the risk or variability of a single asset. In financial situations the fluctuation around a stock’s actual rate of return and its expected rate of return is called the risk of the stock. The standard deviation measures the variation of returns around an asset’s mean. Sheila obtains the rates of return on each asset for the last five years and calculates the means and standard deviations of each asset. The results are shown in Table 1. Notice that each asset has the same average rate of return of 12.2%. However, once Sheila obtains the standard deviations, it becomes apparent that asset B is a more risky investment.
Year
|
Rates of return
|
|
Asset A
|
Asset B
|
|
5 years ago
|
11.3%
|
9.4%
|
4 years ago
|
12.5
|
17.1
|
3 years ago
|
13.0
|
13.3
|
2 years ago
|
12.0
|
10.0
|
1 years ago
|
12.2
|
11.2
|
Total
|
61.0
|
61.0
|
Average rate of return
|
12.2%
|
12.2%
|
Standard deviation
|
0.63
|
3.11
|
No comments:
Post a Comment